






How to Export Gloss Measurement Data to Excel Malaysia

How to Export Gloss Measurement Data to Excel Malaysia
Linshang LS192 Gloss Meter PC Software, Excel Reporting and Factory QC Data Management Guide
Gloss measurement data export is an important part of modern manufacturing quality control.
Factories in Malaysia often need more than a single gloss reading displayed on an instrument.
Quality engineers may need to record measurements, compare production batches, calculate average gloss, investigate variation and prepare inspection reports for customers.
For example, a powder coating factory may measure several painted panels during production.
Instead of recording every result on paper, the factory may prefer to organise the readings in Microsoft Excel for reporting and traceability.
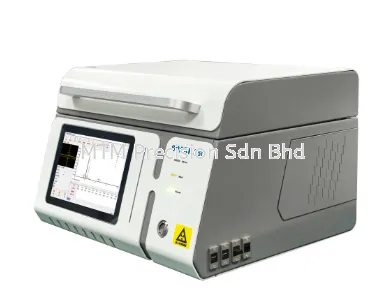
The Linshang LS192 Gloss Meter is a portable 60 degree digital gloss meter with a specified measurement range of 0–1000 GU.
The LS192 supports PC software and data export functions, which can assist with suitable inspection documentation workflows.
In this guide, MTM Precision Sdn Bhd explains how to prepare gloss measurement records, organise readings in Excel and develop a practical digital quality control reporting system.
1. Why Is Gloss Measurement Data Export Important?
A gloss meter provides numerical readings in Gloss Units (GU).
However, manufacturers often need to manage large quantities of inspection data.
For example, a factory may inspect:
20 painted metal panels
50 plastic components
10 powder coating samples
Multiple production batches
Different supplier materials
Several measurement locations per product
Recording every result manually can become time-consuming.
Digital records help factories organise and review inspection information.
Benefits of Digital Gloss Records
Reduce repetitive manual documentation
Organise production batch results
Calculate average gloss
Identify maximum and minimum readings
Evaluate gloss variation
Compare production batches
Prepare customer inspection reports
Support quality traceability
Maintain historical measurement records
A digital workflow is particularly useful when the same product specification is checked repeatedly.
2. Linshang LS192 Gloss Meter Overview
The Linshang LS192 measures specular surface gloss using fixed 60 degree measurement geometry.
Its readings are expressed in GU.
Main Specifications
SpecificationLinshang LS192Instrument TypeDigital Gloss MeterMeasurement Geometry60 DegreeMeasurement Range0–1000 GUDisplay Resolution0.1 GUMeasurement ModesNormal and QCPC SoftwareSupportedData ExportExcelCharging InterfaceUSB Type-CMain ApplicationSurface Gloss Inspection
The LS192 can support suitable surface gloss inspection applications in manufacturing.
Important: The exact PC software features, supported operating systems, connection procedures and export options should be confirmed using the manufacturer's current documentation.
A USB Type-C interface does not automatically mean that every USB cable or computer configuration will support data transfer.
3. What Information Should Be Included in a Gloss Inspection Report?
A useful gloss inspection report should contain more than the measured GU value.
Recommended information includes:
Company Name
Product Description
Product Part Number
Production Batch
Inspection Date
Instrument Model
Instrument Identification
Measurement Angle
Surface Material
Measurement Location
Individual Gloss Readings
Average Gloss
Maximum Reading
Minimum Reading
Gloss Variation
Acceptance Criteria
Inspection Result
Inspector Name
This information helps factories understand which product was measured, how it was inspected and whether it satisfied the approved requirements.
A complete inspection record should support traceability and repeatability.
4. How to Prepare Linshang LS192 for Data Export
Before transferring or recording measurement data, confirm that the instrument is operating correctly.
Step 1 - Check the Instrument
Inspect the measuring window and reference standard.
Perform the required verification procedure according to the manufacturer's instructions.
Step 2 - Confirm the Measurement Method
Check that the required measurement angle is 60 degrees.
The LS192 is a fixed 60 degree gloss meter.
Step 3 - Prepare the Sample
Ensure that the surface is clean, dry and suitable for measurement.
Step 4 - Identify the Product
Record the product name, batch number and inspection location.
Step 5 - Confirm the Software Requirements
Check the manufacturer's documentation for the supported PC software and compatible computer environment.
Step 6 - Prepare a Suitable USB Connection
Use the manufacturer-recommended connection method and cable.
Step 7 - Confirm the Data Workflow
Determine whether the required workflow involves direct measurement transfer, stored measurement retrieval or another supported software function.
The exact LS192 software procedure should be verified against the official user manual and current software version.
5. How to Export Gloss Measurement Data to Excel
The following describes a general workflow for preparing an Excel-based gloss inspection report.
It is not a substitute for the manufacturer's model-specific software instructions.
Step 1 - Obtain the Official Software
Use the manufacturer's approved software package where required.
Avoid installing software from unknown sources.
Step 2 - Check Computer Compatibility
Confirm the supported operating system, connection requirements and software version.
Step 3 - Connect the Instrument
Connect the LS192 using the manufacturer-specified method.
Step 4 - Open the Software
Launch the official software and confirm that the instrument is recognised.
Step 5 - Access Measurement Data
Use the supported software function to view or retrieve the relevant gloss readings.
Step 6 - Select the Required Data
Identify the readings needed for the inspection report.
Step 7 - Export the Data
Use the software's available export function according to the official instructions.
The resulting file format and export procedure may depend on the software version.
Step 8 - Open or Import the Data in Excel
Where a compatible spreadsheet format is available, open or import the exported data into Microsoft Excel.
Step 9 - Add QC Information
Include product identification, acceptance limits, inspection date and other required information.
Step 10 - Save the Report
Save the completed inspection report using a controlled file name.
If direct Excel export is unavailable in a particular software configuration, inspectors may organise readings manually in an Excel template while retaining the original measurement records.
6. Example Excel Gloss Inspection Report
Consider a Malaysian manufacturer inspecting painted electrical cabinet panels.
The customer requires:
Target Gloss: 70 GU at 60 Degrees
Tolerance: ±5 GU
Acceptance Range: 65–75 GU
The inspector measures five representative positions.
Example Measurement Table
Measurement PositionGloss ReadingUpper Left69.2 GUUpper Right70.5 GUCentre71.1 GULower Left68.9 GULower Right70.3 GUAverage70.0 GU
The readings can be entered into an Excel worksheet.
Additional columns may contain:
Product identification
Batch number
Measurement date
Measurement angle
Lower acceptance limit
Upper acceptance limit
Inspection status
Note: These are illustrative measurements and acceptance criteria, not universal industrial standards.
7. How to Calculate Average Gloss in Excel
Average Gloss is the arithmetic mean of the selected measurements.
Formula
Average Gloss = Sum of Readings / Number of Readings
Suppose the gloss readings are entered in cells B2 to B6.
The Excel formula is:
=AVERAGE(B2:B6)
Example
Readings:
69.2, 70.5, 71.1, 68.9 and 70.3 GU
The average is:
70.0 GU
Average gloss can be useful for comparing batches, but it should not automatically replace individual acceptance checks.
8. How to Calculate Maximum and Minimum Gloss in Excel
Excel can identify the highest and lowest readings in a measurement set.
Maximum Gloss
=MAX(B2:B6)
Minimum Gloss
=MIN(B2:B6)
For the example data:
Maximum Gloss = 71.1 GU
Minimum Gloss = 68.9 GU
These values help inspectors understand the spread of measurements.
9. How to Calculate Gloss Variation in Excel
Gloss Variation can be expressed as the difference between the maximum and minimum readings.
Formula
Gloss Variation = Maximum Reading - Minimum Reading
In Excel:
=MAX(B2:B6)-MIN(B2:B6)
For the example:
71.1 - 68.9 = 2.2 GU
The measured variation is:
2.2 GU
This value can be compared against a documented factory uniformity requirement.
However, maximum-minus-minimum variation is only one statistical indicator.
It does not replace a complete process capability or measurement system analysis.
10. How to Create Automatic Pass or Fail Results in Excel
Excel can compare readings against approved acceptance limits.
Suppose:
Lower Limit = 65 GU
Upper Limit = 75 GU
The gloss reading is stored in cell B2.
An example Excel formula is:
=IF(AND(B2>=65,B2<=75),"PASS","FAIL")
Example Results
Gloss ReadingExcel Result64.5 GUFAIL65.0 GUPASS69.8 GUPASS75.0 GUPASS75.6 GUFAIL
This example assumes that both boundary values are included.
For formal conformity assessment, the factory should also consider its approved decision rule and measurement uncertainty requirements.
Excel formulas should follow the approved QC specification rather than define the specification themselves.
11. How to Compare Gloss Between Production Batches
A factory may want to compare the average gloss of several production batches.
Example Batch Summary
Production BatchAverage GlossBatch A69.8 GUBatch B70.5 GUBatch C71.2 GUBatch D67.9 GUBatch E70.1 GU
Excel can be used to organise the results and create a trend chart.
This may help the factory identify changes over time.
However, batch averages alone may conceal individual out-of-limit readings.
For more reliable quality control, the factory should retain individual measurements and evaluate the approved acceptance criteria.
12. How to Build a Gloss Measurement Trend Chart
A trend chart can help visualise changes in gloss measurements across production batches.
Recommended Procedure
Step 1: Record each production batch.
Step 2: Calculate the average gloss for each batch.
Step 3: Select the batch and average gloss columns.
Step 4: Insert a line chart in Excel.
Step 5: Add the approved target gloss.
Step 6: Include acceptance limits where appropriate.
Step 7: Review the trend for unexpected changes.
A trend chart can reveal patterns that may be less obvious in a table.
However, the factory should not treat ordinary specification limits as statistical process control limits.
Specification limits and statistical control limits serve different purposes.
13. Recommended Excel Template for Factory Gloss QC
A practical worksheet may contain the following columns.
ColumnInformationAInspection DateBProduct CodeCBatch NumberDMeasurement PositionEGloss Reading GUFLower LimitGUpper LimitHPass or FailIInspectorJRemarks
For a more detailed report, the factory may create a separate summary worksheet.
Summary Worksheet
Recommended fields include:
Product identification
Production batch
Number of measurements
Average gloss
Maximum gloss
Minimum gloss
Gloss variation
Number of failed readings
Final inspection decision
This structure supports both individual measurement traceability and batch-level reporting.
14. Common Problems During Gloss Data Export
Problem 1 - Computer Does Not Recognise the Instrument
Possible causes include an unsuitable cable, connection issue or software compatibility problem.
Recommended Action: Check the official software instructions, supported operating system and manufacturer-recommended cable.
Problem 2 - Exported Data Cannot Be Opened in Excel
The exported file may require a different import procedure or compatible software.
Recommended Action: Confirm the actual export format and use the appropriate Excel import function.
Problem 3 - Measurements Are Missing
The selected data range or supported retrieval function may not include all required readings.
Recommended Action: Verify the measurement records and supported software workflow before finalising the report.
Problem 4 - Excel Formulas Produce Incorrect Results
Possible causes include incorrect cell references or non-numeric data.
Recommended Action: Check the formula range and confirm that the readings are stored as numbers.
Problem 5 - Wrong Acceptance Limits Are Used
The worksheet may contain limits from a different product specification.
Recommended Action: Use controlled templates and verify the product-specific limits before inspection.
Problem 6 - Data Cannot Be Traced to a Production Batch
The report may be missing batch numbers or inspection dates.
Recommended Action: Include product and batch identification in every inspection record.
15. Best Practices for Digital Gloss Inspection Records
Factories can improve reporting consistency by following a documented procedure.
Use Standardised File Names
For example:
ProductCode_BatchNumber_GlossInspection_Date.xlsx
Maintain Controlled Templates
Use an approved Excel template with verified formulas.
Protect Important Formulas
Where appropriate, protect formula cells against accidental changes.
Record Instrument Information
Include the instrument model and identification.
Record Measurement Geometry
Always state:
60 Degree Gloss Measurement
Keep Original Measurement Records
Retain original records where required by the quality system.
Review Reports Before Approval
Ensure that all measurements, calculations and acceptance decisions are correct.
Back Up Inspection Data
Store reports according to the company's data retention and backup procedures.
A reliable digital QC system requires both accurate measurement and good record management.
16. Gloss Data Export Applications in Malaysia
Digital gloss inspection reporting is relevant to manufacturing industries throughout Malaysia.
Selangor and Kuala Lumpur
Industrial coating, automotive components, plastic manufacturing, electrical cabinets and factory quality control.
Johor
Powder coating, metal fabrication, automotive suppliers and industrial surface finishing.
Penang and Kedah
Electronics housings, precision manufacturing, industrial equipment and supplier inspection.
Perak and Negeri Sembilan
Plastic products, industrial painting, metal fabrication and production QC.
Melaka and Pahang
Automotive components, industrial machinery and coated product inspection.
Kelantan, Terengganu, Perlis, Sabah and Sarawak
Suitable manufacturing, industrial maintenance and surface finishing applications.
MTM Precision Sdn Bhd supports customers throughout Malaysia looking for suitable industrial measuring instruments.
17. Frequently Asked Questions About Gloss Meter Data Export
Can Linshang LS192 export gloss measurement data?
The LS192 supports PC software and data export functions. The exact workflow should be verified using the manufacturer's current software documentation.
Can I use Excel to analyse gloss readings?
Yes. Excel can calculate averages, maximum and minimum values, variation and inspection results.
Does LS192 connect to a computer?
The LS192 has a USB Type-C interface and supports PC software. Confirm the required cable, operating system and connection procedure before use.
Can Excel calculate average gloss automatically?
Yes. Use the AVERAGE function.
Can Excel calculate gloss variation?
Yes. Subtract the minimum reading from the maximum reading.
Can Excel show Pass or Fail results?
Yes. The IF and AND functions can compare readings against approved limits.
Is an Excel report equivalent to a calibration certificate?
No. An Excel inspection report documents measurements and inspection results. It is not automatically an instrument calibration certificate.
Can LS192 measure coating thickness?
No. A separate coating thickness gauge is required.
Can LS192 measure colour difference?
No. A suitable colorimeter is required.
Where can I buy Linshang LS192 in Malaysia?
Contact MTM Precision Sdn Bhd for quotations, product information and assistance with gloss meter selection.
18. Buy Linshang LS192 Gloss Meter for Factory QC Reporting Malaysia
If your company requires a Linshang LS192 Gloss Meter Malaysia, Gloss Meter with Data Export, 60 Degree Gloss Meter, or Industrial Gloss Inspection Instrument, contact MTM Precision Sdn Bhd.
We support customers involved in:
Industrial Paint Inspection
Powder Coating Quality Control
Plastic Manufacturing
Automotive Components
Metal Surface Finishing
Factory Quality Control
Supplier Quality Inspection
Digital Inspection Reporting
Customers may send photographs of their products, required gloss range and reporting requirements through WhatsApp for an initial product suitability assessment.
Our team can help determine whether the LS192 is appropriate for the intended measurement and reporting workflow.
MTM Precision Sdn Bhd - Malaysia
Showroom & Service Centre
No. 29-1 & 29-2, Jalan Bandar 18,
Pusat Bandar Puchong,
47160 Puchong, Selangor, Malaysia.
Telephone: 03-8080 7172
WhatsApp: +6016-660 7346
Email: mtmpre@yahoo.com
Website: www.mtmpre.com.my
Business Hours: Monday to Friday, 9:00 AM - 6:00 PM
Contact MTM Precision Sdn Bhd for Linshang LS192 Gloss Meter pricing, gloss measurement data export and factory QC reporting solutions in Malaysia.
13 Oct 2026


